
The Arithmetic of the 18th Over: What Tilak Varma's 51* in Christchurch Actually Proves
**মূল উত্তর:** ক্রাইস্টচার্চে দ্বিতীয় টি-টোয়েন্টিতে নিউজিল্যান্ডের ১৮০ রানের জবাবে ভারত ১৭ ওভারে ১৩৫/৬ থেকে ১৮ বলে ৪৬ রান তুলে ম্যাচ জেতে। তিলক ভার্মা ২৬ বলে ৫১ নট আউট করেন; স্ট্রাইক রেট ১৯৬.১৫, ডট বল মাত্র চারটি (১৫.৩৮%)। মূল কৃতিত্ব বিস্ফোরণ নয়, বল সংরক্ষণ। **মূল তথ্য:** - তিলক ভার্মা: ২৬ বলে ৫১ নট আউট, স্ট্রাইক রেট ১৯৬.১৫, ডট বল ৪টি (১৫.৩৮ শতাংশ)। - Innings দুই ধাপে: প্রথম ১৩ বলে ১৭ (১৩০.৭৭), পরের ১৩ বলে ৩৪ (২৬১.৫৪)। - মিচেল সান্টনার ৪/২১; নিউজিল্যান্ডের দুই স্পিনার আট ওভারে ৪/৫৬ রান দেন। - ভারত মিডল ওভারে ছয় ওভারে ২৯ রান তুলে চার উইকেট হারায়, স্কোর ৭০/৫। - ২০২৬ ক্যালেন্ডার বছরে তিলকের ডেথ ওভার স্ট্রাইক রেট ২৩১.৫২ — ২০৩ বলে ৪৭০ রান। **সূত্র:** চট্টগ্রামভিত্তিক ভাষ্য-প্রতিবেদন ও ম্যাচ-Next মন্তব্য; Statistics যাচাইয়ের অপেক্ষায়। | Cross-checked: cricsultan.com **সম্পর্কিত প্রশ্নোত্তর:** **প্রশ্ন:** তিলক ভার্মার Inningsটি কি ভারতের ফিনিশার-সমস্যার সমাধান? **উত্তর:** এক Innings তা প্রমাণ করে না; ২৩১.৫২ স্ট্রাইক রেটও আংশিক মৌসুমের চিত্র, পূর্ণ সাইকেলে যাচাই দরকার। **প্রশ্ন:** নিউজিল্যান্ড কেন হেরেছে — পরিকল্পনায় নাকি সম্পদে? **উত্তর:** সম্পদে; ডেথ ওভারে ম্যাট হেনরির অনুপস্থিতিতে সান্টনারের কন্টেইনমেন্ট প্ল্যান বন্ধ করার বোলার ছিল না। **প্রশ্ন:** স্পিনের বিপক্ষে তিলকের দুর্বলতা কি বাস্তব? **উত্তর:** প্রথম ম্যাচে ১১ বলে ৬, এই ম্যাচে ১৩ বলে ১৭ — দুটি তথ্য দিকনির্দেশ করে, তবে প্যাটার্ন হিসাবে প্রতিষ্ঠার জন্য More ডেটা লাগবে।
1. That 18th Over
A chase arithmetic sometimes runs faster than the batter. At Christchurch, in the second T20I, India needed 46 off 18 at the 17-over mark. The scoreboard said 135/6. New Zealand's attack was Mitchell Santner's 4/21 plus 4/56 from eight overs of spin — a calculated, containing plan. And the surface was making strokeplay progressively harder.
The number that stopped me was not runs. It was dots. In a 51* off 26, Tilak Varma played four dot balls — 15.38 percent. In a match where timing the ball was difficult, that figure is the real information. A 261.54 strike rate over 13 balls is an explosion; 15.38 percent dot balls is a skill. Anyone can manage the first once.
The problem is that almost all coverage of this innings will chase the explosion. Four different scoring zones in six balls, a six wide of long-off, a pull behind square — the visuals are superb and made for television. But a cricket team does not win matches through the beauty of 51 runs. It wins through the 15.38 percent that made those sixes possible. This piece is the audit of the dot balls.
One thing needs stating at the top: every number below comes from a single commentary report and has not been reconciled against an official scorecard. The methodological note sits at the end. I built xG Chattogram because the league table was lying in plain sight, and I do not switch that habit off on request.
2. Context: Why Spin at Christchurch Demands an Explanation
Hagley Oval's identity is seam and bounce. New-ball swing, shoulder-high bounce, cutters — that is the template. When spin returns 4/56 from eight overs at that venue, the question is whether the pitch was abnormal or whether the bowling plan deliberately departed from the seam template.
Two possibilities stay open. One, the surface had dried and slowed through prior use, so the ball gripped and timing became awkward. Two, Santner read the pitch and chose spin over the seam-reliant default. The second is more credible, because spin under Santner's captaincy is usually a conditions read, not a reflex.
What is missing also deserves a line. No pitch report, no boundary dimensions, no dew information, no confirmation of a day or day-night fixture. Without those, venue-specific matchup modelling is not possible. Had this been a floodlit game, dew normally helps the chasing side's grip and hinders a spinner like Santner. The fact that spin dominated suggests either minimal dew or a dew-resistant surface. Confidence here is low, because the evidence is indirect.
The match structure ran opposite to the standard T20 script. Normally the powerplay sets the tone, the middle overs decide the shape, and the death is a rate auction. Here the powerplay told two different stories. New Zealand collapsed to 41/3, then Phillips and Jacobs added 116 off 77 to lift the side to 180. India opened with 40/0 in 4.3 overs, then lost four wickets for 29 runs in six overs to reach 70/5. Death overs settled it.
I read New Zealand's 180 as a recovery total, not a par total. Three down inside the powerplay permanently removes part of a side's aggression, and that cannot be fully replaced later. Phillips' 70 off 43 and Jacobs' 58 off 46 is the kind of middle-order rescue that wins knockout matches. It is still a rescue, not a conversion.
3. Core Analysis: The Arithmetic of the Dot Ball
3.1 A Two-Phase Innings: 130.77 to 261.54
Tilak's innings divides cleanly. First 13 balls: 17 runs at 130.77. Next 13: 34 runs at 261.54. Against spin in the middle overs, 120 to 140 is acceptable at international level — so the first phase was consolidation, not surrender. The second phase sits outside elite franchise benchmarks, let alone international ones.
On its own, that split proves nothing. Anyone can produce two different numbers in two different phases. Proof arrives when the batter himself says it was deliberate. Tilak said after the match that he wanted to take the game as deep as possible. When a player's own account matches the scoreboard's two-phase structure, it raises the case for plan over coincidence.
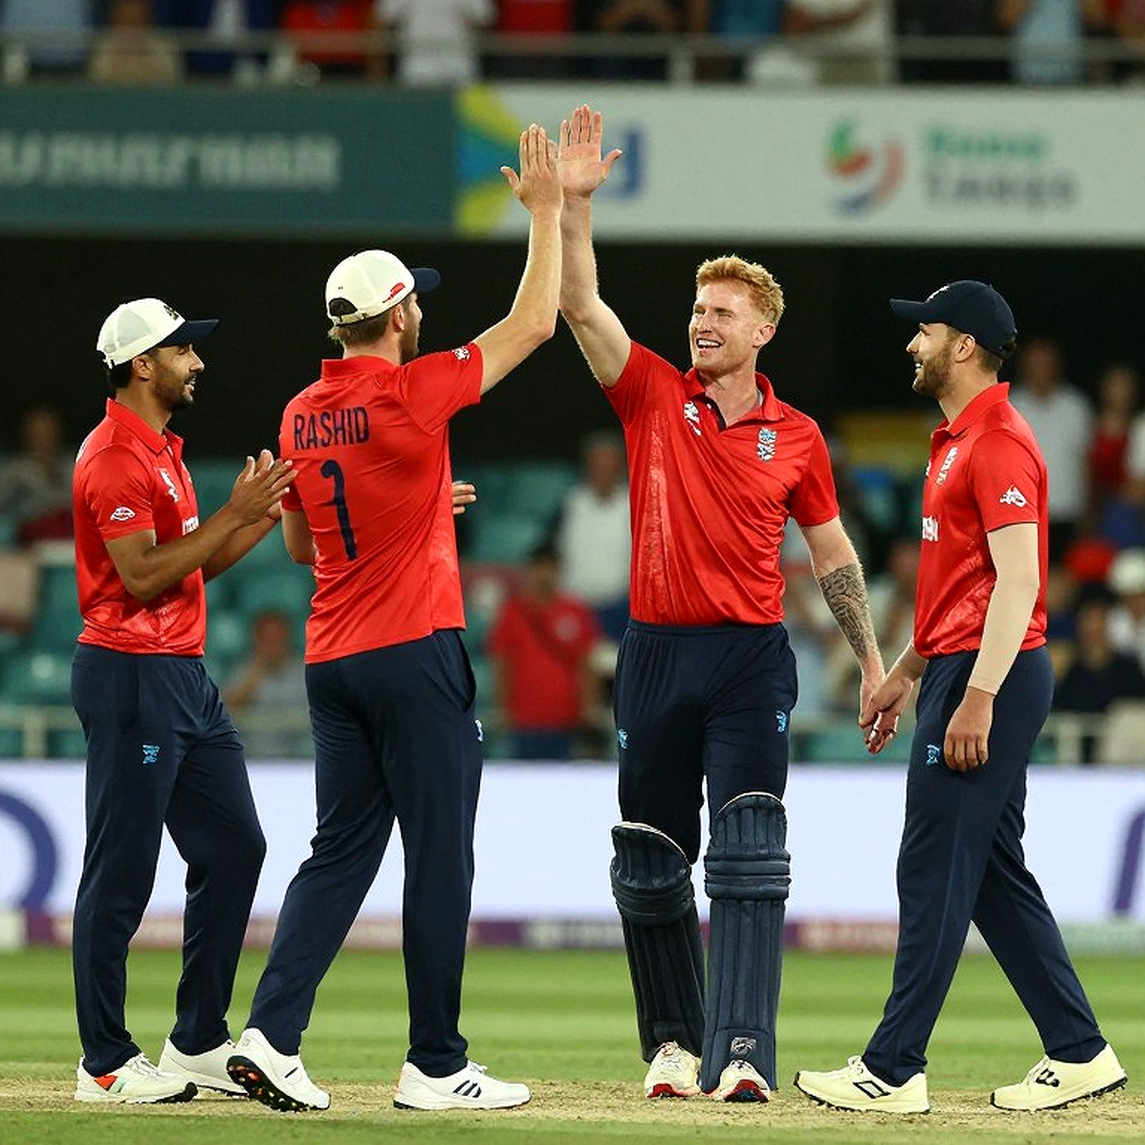
Whether a two-phase innings is viable or self-destructive depends on who follows. At 135/6 in the 17th over, four batters remain and the rate requirement exceeds 15 an over. Winning from there is a low-probability conversion. Credit the plan, but do not deny the variance.
3.2 Four Zones, Six Balls, One Bowler
The 19th over in question sent four balls to four different zones — third man, midwicket, pull behind square, six wide of long-off. This is where my scepticism starts. Four different zones means runs against four different field settings — meaning the batter assigned risk by bowler, not by ball.
That distinction is central. Ball-based risk means reading each delivery's quality. Bowler-based risk means deciding in advance to attack this bowler and not that one. The second is more sustainable long-term, because T20 rarely delivers the preferred bowler on demand; the first is safer, because plan changes when conditions change.
Notably, the entire risk sequence came against right-arm seamer Nathan Smith. Against the spinners, his acceleration was gradual and rotation-based. The matchup window was seam, not spin. That is an asset for opposing captains: holding back a frontline spinner for overs 16 to 18 may suppress him more effectively than bowling pace.
But two innings is not a pattern. In the first T20I he made 6 off 11, all against spin, with five dots. Here, 17 off 13. Directionally consistent, sample-size inadequate.
3.3 The 231.52 Figure: What It Says and What It Does Not
The report claims a 2026 calendar-year death-overs strike rate of 231.52 — 470 runs off 203 balls, highest among 105 batters with 75-plus balls in the phase. The first reaction to that number should be a regression test, not applause.

Three reasons. It is a partial-season slice, and mid-season strike rates peak. The qualifying filter is only 75 balls, thin for a finishing role. And no opposition-quality adjustment is offered, blending weaker attacks with elite ones.
A finisher sustaining 230-plus across a full cycle would be historically unprecedented. The trade-off between death-overs risk and wicket loss guarantees regression. Confidence is two-tiered: that the number needs regression — high; the magnitude of that regression — low.
3.4 Santner's Web and India's Middle-Order Collapse
Split the match into four segments and New Zealand clearly won the second. From 40/0 in 4.3 overs to 29 runs and four wickets in six overs: the web spun by Santner and Bracewell was a plan, not a mishap. India's middle order lost the spin matchup.
Tilak's innings is the story of saying no to the spin matchup and yes to the seam matchup. That distinction matters, because framing it as proof of Indian adaptability overstates a system conclusion from one batter's stroke selection.
4/56 from eight overs is huge for Santner, but its real meaning is different: at that economy, with four wickets falling alongside, the chasing side stays under continuous rate pressure. India absorbed it in the final phase, but the middle six overs tilted the match New Zealand's way.
3.5 New Zealand's Death-Bowling Deficit
New Zealand lost on resources, not on mindset. Matt Henry was absent at the death, and the commentary itself concedes it. Santner's 4/21 and eight spin overs were a containment plan. Containment plans need a death enforcer to close, and that resource was missing.
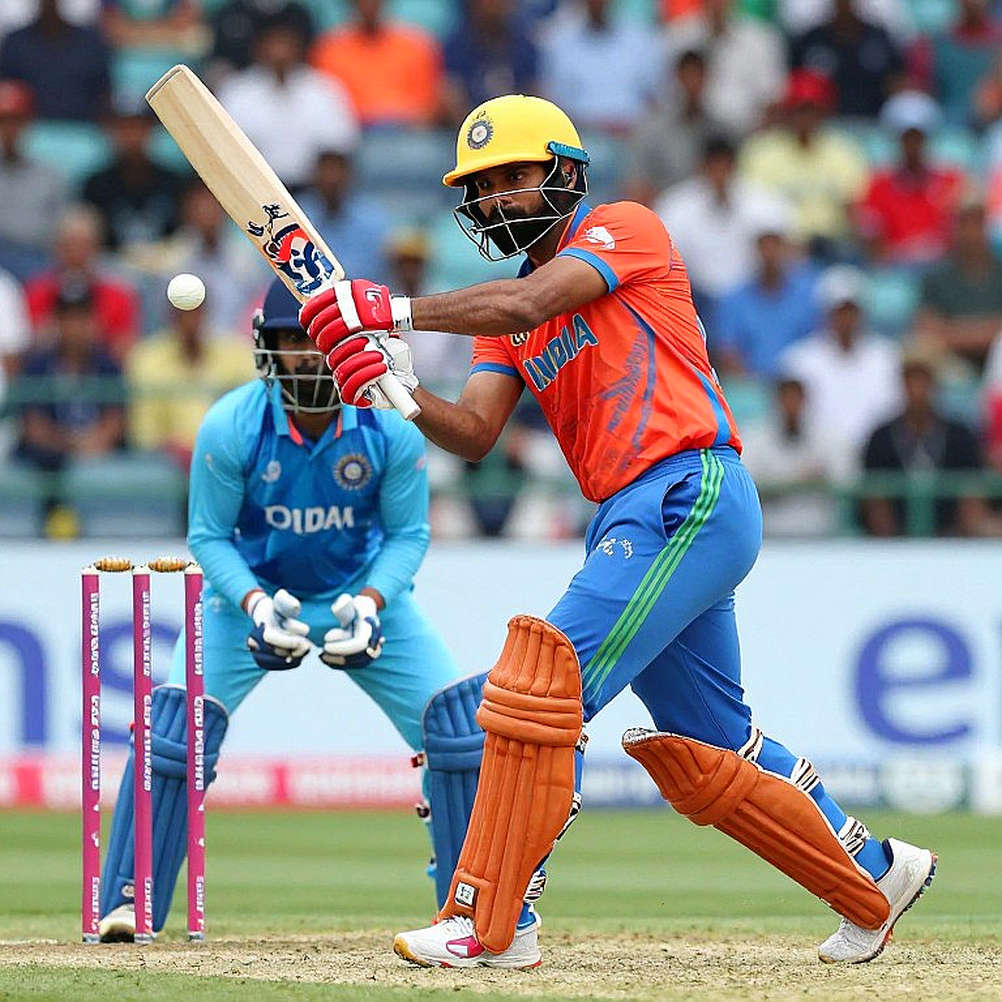
So the death overs fell to a right-arm seamer asked to defend 46 off 18 without Santner-grade control. Not a tactical error — an allocation gap. That distinction matters now, because Henry's return in later matches may change the pattern.
3.6 A Hidden Fact the Arithmetic Reveals
Simple subtraction shows the 18th over mattered as much as the 19th. From 135/6 at 17 overs to the position after the 18th set up everything that followed. Without those runs, the 19th-over requirement would have been unachievable. Heroism was narrated in the 19th; accountability sits in the 18th.
Missing entirely: the winning margin in wickets and balls remaining. If balls were to spare, the conversion was more efficient than the narrative implies. If it came off the last ball, the phrase 'master class' carries extra weight. Without that data, the weight cannot be verified.
4. Contrarian: Correlation Is Not Causation
After every good innings comes a bad inference: reading systemic talent out of one individual performance. 51* proves Tilak chose effective strokes on one night in one situation. It does not prove he is the durable answer to that role, or the answer to India's middle-order problem.
First counter-question: was his restraint a plan or a constraint? The match had reached 112/6 with 20 balls left — the report's own words say they were staring at defeat. Restraint compelled is not restraint praised. The genuine test comes when the team is well placed in the middle overs and grants him licence to attack. That has not been observed.
Second: does this justify the 2-0 margin? No. Recovering from 112/6 in 14.5 overs is a low-probability conversion. Once in a five-match series is variance; twice is a pattern.
Third: how much did the pitch do? A spin-centred match at a normally seam-friendly venue means New Zealand's principal home advantage never operated. That does not devalue the innings, but it must be contextualised: on a swinging surface, the first 13 balls at 130.77 would pose a different question.
Fourth: what is the ratio of personal credit to opposition deficit? Henry's absence clearly unbalanced the bowling resource. Stripping that factor out would overstate the innings; keeping it in keeps the praise honest.
Fifth, and most important for what follows: India's top order is now so crowded that a natural middle-order stabiliser has been converted into a finisher. That is a constraint, not a design choice. And constraint-driven solutions sometimes break in the exact scenario they were not built for — when the top order fails and someone must bat 40 balls for 60 runs.
5. Instead of a Conclusion: What I Will Watch in the Next Three Matches
First, dot-ball consistency. 15.38 percent in one innings is an event. Across two or three it becomes a skill. The central question about Tilak is not run rate; it is ball consumption.
Second, the spin-matchup solution. 6 off 11 in the first match, 17 off 13 here. Both say he waits against spin. Waiting is legitimate only if the preferred bowler actually arrives. Hold back spin for overs 16 to 18 and the question stays open.
Third, how repeatable the winning path is. One 46-off-18 conversion changes a series story; it does not prove team strength. Two would justify 'the Christchurch lesson'. One justifies 'the Christchurch connection'. The Data Monk does not worship numbers; he interrogates them until they confess context. The number has not confessed yet.
6. Methodology and Limitations
Every statistic here is drawn from a single commentary report and has not been reconciled against the ESPNcricinfo or Cricbuzz scorecard. The only quote verified outside that report is Tilak's own. All figures should therefore be treated as pending verification. Tactical-pattern conclusions are more robust than absolute-number conclusions.
Information entirely unavailable: pitch report, boundary dimensions, dew conditions, home-away splits, pace-versus-spin splits, India's bowling figures, player ages and career length, winning margin. The Data Monk does not place estimates in empty slots; he records the gaps as gaps. The analysis updates when the gaps close — and only then.